bonde do Chapad�o invade comunidade do TCP em Barros filho

Segundo informa��es os traficantes do Comando Vermelho invadiram a comunidade da Eternit (TCP) em Barros Filho, na zona norte do Rio de Janeiro.

O bonde que puxou para a Eternit saiu do Chapad�o (CV) em Costa Barros.

Foram os soldados ligado do Sandro Mica e Cabeludo, desceram para a comunidade da Eternit com apoio do Chaves (CV), e pegaram dois soldados do Terceiro Comando Puro.

Voltaram para o Chapad�o (CV) com uma bolsa cheia de droga e duas pistolas.

O frente da Eternit conhecido como Mauricio, avisou para os rivais que esse baque vai ter volta.

Vamos aguardar.

ShinyGO! A beautiful, simple and powerful online data interpretation tool.

I didn’t want to write about this one until I got these stupid manuscript edits out the door, because I needed ShinyGO and I didn’t want anyone else slowing it down.

“Minor” edits done! Tool sharing time! You can read about ShinyGO here.

Don’t feel like reading? You can play with ShinyGO online here!

Are there lots of tools like this out there hiding on the web? Yup! There sure are, but this honestly might be the easiest way to dig through a bunch of different resources all at once. You will need to get your protein list to universal gene identifiers or something similar (it’ll translate several different types) and then you can start doing all sorts of analyses. For the figure above, I let ShinyGO select the closest related organism (ended up being Scumbag Arabidopsis) and I flipped through different databases until I got some visualizations that made my data make some sense (turned out being a nice visualization of KEGG resources with pathway representation scaled.  I found that the best way to get what I wanted was to take the proteins that are up/down regulated separately and then create my network and then compare them. Worked for this model organism!

I love the fact that I can move my network nodes around and then export the image with them in that place. If you don’t like that particular visualization you can export the Edges and Nodes and import them into your tool of choice.

At long last — A Guidance Document for HLA Peptides!

Twenty somethig years of analyzing HLA Class I/II antigens with mass spectrometry and we need to face facts — mass spectrometry of these things still sucks. Important? Yes. Super incredibly important. But mobile protons are NOT a fun thing for us to work with as our exclusive charge acceptor. Our technologies work best with doubly charged peptides that end in lysines or arginines.

But LCMS is the only thing that has ever worked at all for these molecules, so we’re stuck with them. What we need is a set of guidelines to at least reference — and here is the first one I’ve seen! 

Honestly, I expected this to have maybe 50 different authors on it as some sort of an over arching consensus of a big meeting on the topic to sort it out. And, that might make me a little more comfortable, but I tell you what, this document is not bad at all. You know why?

This group has actually validated some HLA peptides and successfully utilized them! This isn’t a big hypothetical piece. This is the next stage beyond where most of us have been going. I came out thinking it was really sobering. On our side we’re pressured to find more and more of these peptide identifications and hitting so many hundred or thousand is the only metric we have. We don’t need to find 1,500 mediocre peptides. We need to find the one really good one that differs in the cell type you want to target. This isn’t a long read and if you’re doing these kinds of studies, I 100% recommend it.

Guerra de faco voltou assustar os moradores no Morro do Adeus

Quieto por um tempo, os moradores voltaram a sofrer com o tiroteio entre faces no Morro do Adeus em Bonsucesso, na zona norte do Rio de Janeiro.

Nos ltimos dias os traficantes do Complexo da Mar, voltaram a invadir o Morro do Adeus para expulsar e retomar a comunidade.

O patrocnio veio do Bonde do Cria, Choco e TH, os lderes do Terceiro Comando Puro dentro da Mar.

Um dos puxadores do bonde conhecido como Piu.

Making publication ready annotated spectra with IPSA and PD (or any other tool)!

IGNORE MY WRITING. Make beautiful MS/MS spectra easily online by pushing this hideous big button. 


Lookin’ to make beautiful spectra for your poster or publication? Just push that big button!! 

This might, yet again, be a post mostly for me, because I can’t seem to remember the name of this tool and I keep going to Google Scholar and looking through 2019 papers from the Coon lab. And that isn’t exactly a one-paper-a-year sort of lab. And since I’m already typing I’m going to show you how to use this awesome tool.

You can read about in in MCP here.

If you need to do something fancy, beyond what the online IPSA tool can do, you can download the whole thing on Github here and manipulate it (or run it locally in your own web browser on your offline computer. 

I’m going to go through this from a Proteome Discoverer centric application using IMP-PD 2.1 (the free PD version that you can get here.).  Sweet! Here is a great tutorial for installing it, I’d not happened into before…as well as a tool I haven’t checked out yet!

One thing Proteome Discoverer has never done (and — honestly — most, if not all software packages) is made images that your editor and reviewers won’t make fun of.  There are some people out there with the kind of exploited students free time that have made them remake all sorts of spectra in things like Adobe illustrator that puts anyone who can’t afford the financial or time costs at a disadvantage. Illustrator images can be so pretty you can hardly look at them

Compare that to your output from your normal tool of choice. Functional? Yes. Pretty? Probably not (and the ones that are pretty, like Scaffold, often don’t contain all the information you want.

IPSA fixes that! You’ll need a couple of things first.

1) Your spectra sequence
2) Exact mass of your post-translational modification, if applicable
3) A clean spectra to work off of

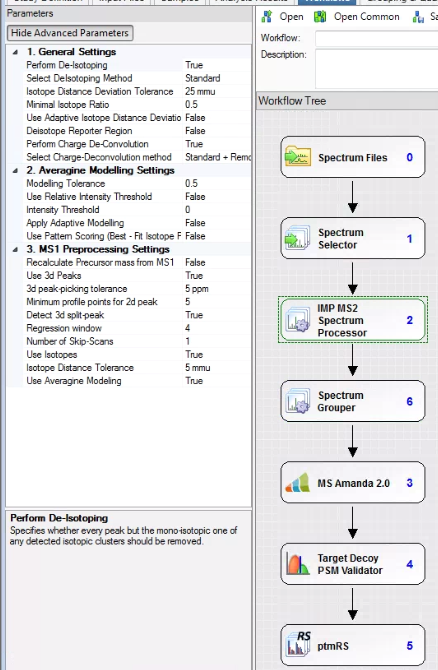
I’ll assume you have both 1 and 2. For number 3 I’m going to use the free version of Proteome Discoverer and version 2.1 because of two nodes that are compatible with 2.1. The IMP-MS2 Spectrum Processor and the Spectrum grouper.

I think the IMP-MS2 spectrum processor has been integrated into MSAmanda 2.0 for later versions of PD, but this is how I’m doing things (PD 2.1, last I checked, was compatible with the largest group of second party nodes and I’ll always keep a version or two installed on everything just in case I need something neat that I don’t have in later versions. I strongly advise you take the 15 minutes when you get a new computer and do the same!)

The MS2 spectrum processor will deconvolute your MS/MS fragments to all singly charged. BOOM! much simpler spectra. It won’t work well, or at all(?) with low resolution spectra, but it works perfectly on the higher resolution ones. You can also deisotope. I do, just so it isn’t so hard to look at everything. It reduces your spectra to the monoisotopic alone. 

The spectrum grouper finds your MS/MS spectra (if you have them) that are clearly duplicates, even if you fragmented the +2 and +3 versions and puts them together if you select grouping on “singly charged mass.” To be perfectly honest, I’m not 100% sure I know what this is doing. I thought I did, but I can’t be 100% sure I know what “grouping” means in this context. Meh. I’ll investigate later.

If you’re trying to annotate PTM MS/MS spectra, befinitely throw in the ptmRS/AScore (at least similar enough to consider together) for into the pipeline.

Run this and make some stupendous identifications!

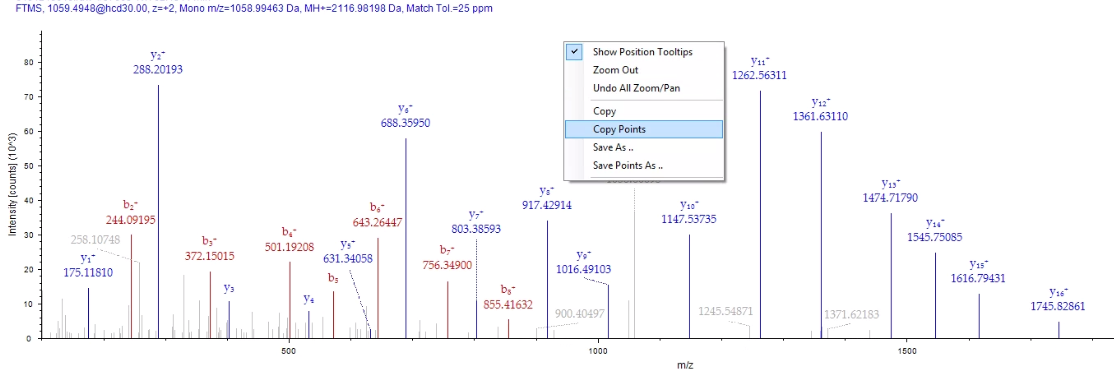
From the PSM tab in PD you can double click on your peptide of interest and bring up a nice and informative MS/MS spectra that your reviewers will make fun of.  If you right click on it, you can select “Copy Points”. This will remove all the MS/MS fragments and these annotations and make a 3 column text output.

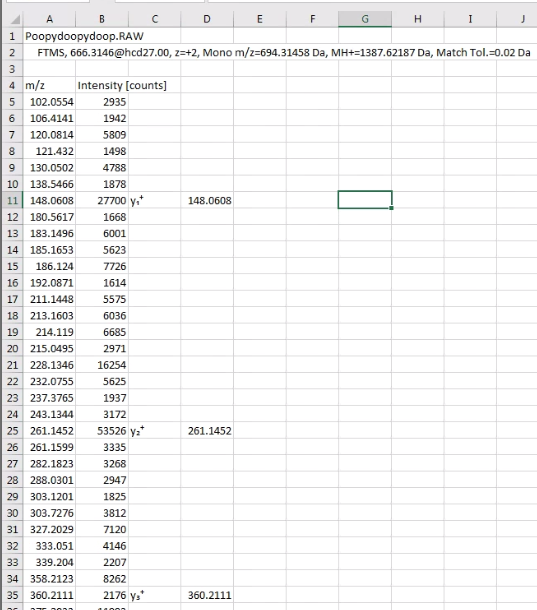
Next, go to Excel or your Excel like program of choice and paste the data into it. It’ll look something like this. (Please note, examples don’t match in image above/below, because I’m lazy.)

I did this so I could ditch the scan headers, which will confuse IPSA. 
All IPSA wants is the MS/MS fragments and intensities. I highlight the cells in rows A &B (columns? I’ll live my entire life without ever truly knowing which is which — thanks, dyslexia, you’re the best!) and copy with ctrl+C, or whatever you Macintosh people use. 
Hit the big button at the top of this blog post and go to IPSA. 
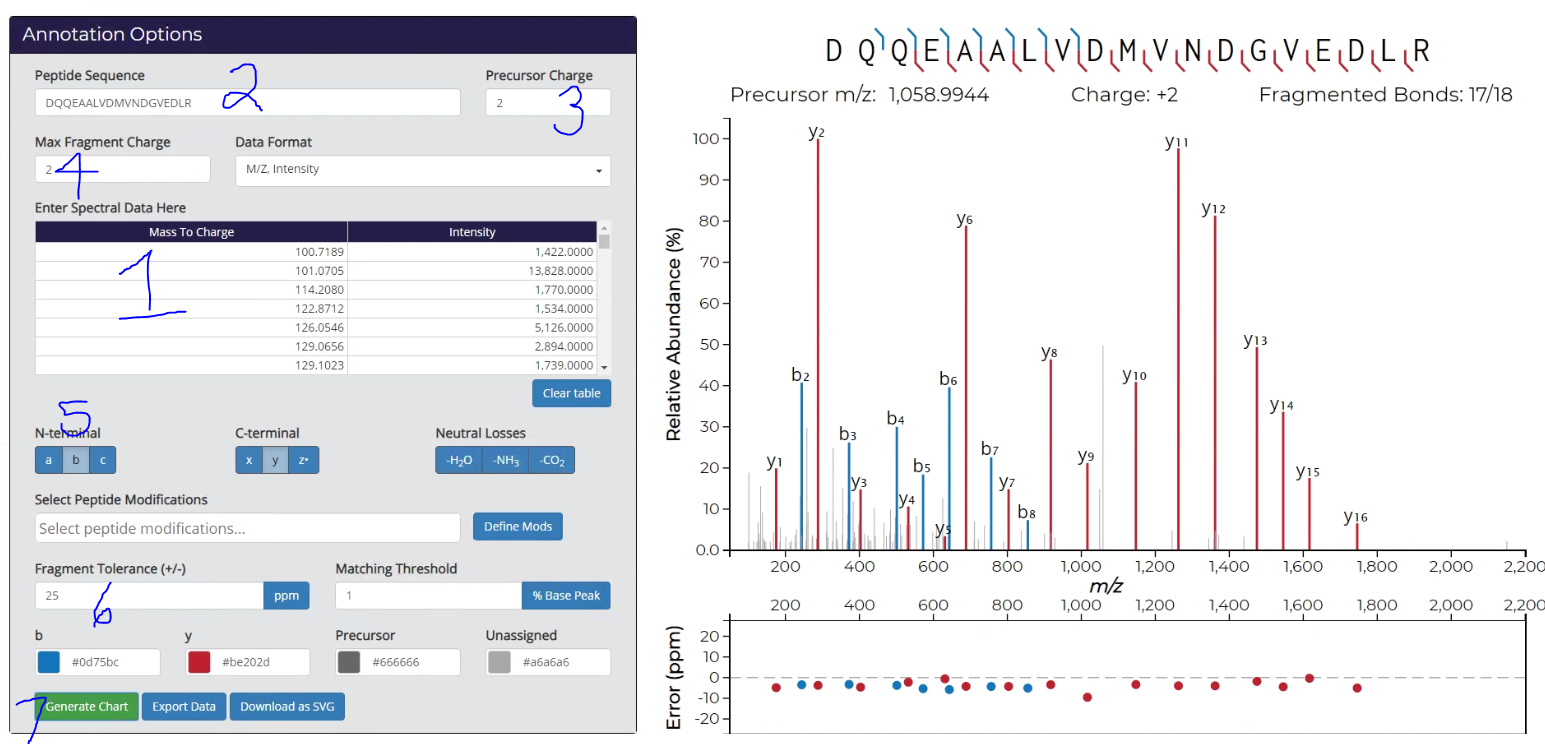
Click to expand the image below. This tool is amazingly straight-forward, but I’m still going to number things. 
1) Ctrl+V your cells into the big obvious box! 

2) Copy/Paste your peptide sequence in. In PD 2.1 it is easiest to do this from the very top line of the Peptide Summary (where you found the “Copy Points” button a couple of images up from this one.

3) Put in the charge state of your peptide.

4) Determine the charge states of the fragments you want to see. I’ve, in error, selected 2 here, which doesn’t make sense in this workflow, but it did make sense with a low resolution spectra I couldn’t deconvolute. Keep in mind that the IMP tool isn’t perfect and may not catch every MS/MS, if the charge state is particularly high. Worth toying with if you’ve got an unexplained fragment.

5) Select the fragment ions you want to see, and whether you want to see neutral losses. I only use them if there are a lot of unmatched MS/MS spectra.

6) Use a reasonable fragment tolerance in Da or PPM. Matching tolerance is how low vs. base peak you want to still label. It defaults to zero which might be too messy. Putting a 5 in means that you won’t label stuff below 5% of base peak.

Okay — so this is reeeeeaaaly cool. If you don’t like where your labels are, height wise, you can move them. See that y5 for example? Just click and drag it up so you can clearly read it. Then when you….

7) Generate your SVG, it keeps it that way! I’d also recommend exporting the data so that you have this output. It makes a handy CSV with the same title (your peptide sequence) as the SVG and saves it in the same place.

Maybe you’re done!  However, if you want to make changes, NOW it’s time to break out Powerpoint or Illustrator.

Illustrator will directly import the SVG and allow you to manipulate it if you know how to use it right. (I don’t and I made my figures much worse).  Powerpoint (at least my 365 version) will directly import the SVG. And then I can make changes to it.

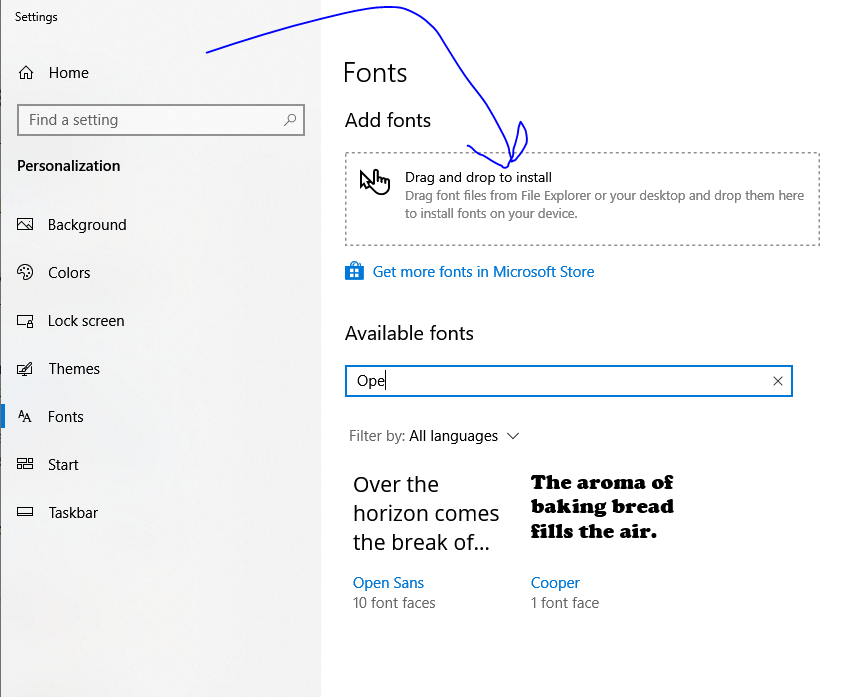
If you want to make changes like add in some text, you aren’t done yet. IPSA uses 3 nonstandard fonts that you probably don’t have installed. At the top of the page there is a button that says “Download fonts”. Do that. Unzip them and then type “Fonts” into your Windows search bar thing.

In Windows 10 (booooooooo!) it’ll look like this.

Predictably, it won’t work quite right, but if you click/drag/drop enough times and say the exact right combination of profanities it will eventually recognize the fonts you uploaded. Powerpoint may not immediately add the new fonts to the font bar, but if you type the name of the font  in the box it will update it.

The spectra are annotated in OpenSans. On my screen to match it exactly with a spectra taking up a full slide, my b/y ions are OpenSans 16.  This may not be universal. The other 2 fonts are the text around the beautiful spectra.

Why am I adding stuff? I’m just putting in the exact mass of the ions that most clearly illustrate where the NAGs are located in my MS/MS spectra, which is never ever ever on tyrosine.

Now that you’ve got your spectra in, add the right arrows and colors, save the image however you want (probably .TIFF, since the image isn’t compressed.) And then I’m done typing!

Gest�o violenta em Queimados desagrada crias do CV local

Segundo informa��es, esta acontecendo uma briga interna entre o Comando Vermelho que domina a comunidade do S�o Sim�o em Queimados.

Segundo relatos de moradores, o antigo frente da comunidade conhecido como Dimulher, foi preso quando se retirava do S�o Sim�o em dire��o ao Complexo da Penha na zona norte do Rio de Janeiro.

Para suprir esse cargo, os chef�es da Penha que comandam o S�o Sim�o, descartaram qualquer outro cria da �rea para o cargo, e colocou um frente que era da confian�a da capital.

Essa atitude da c�pula desagradou 90% dos crias do S�o Sim�o que esperavam por valoriza��o, causando a migra��o dos traficantes do S�o Sim�o em dire��o a Caixa D’�gua, controlado pelo CH da Vila Ruth.

A desconfian�a contra os bandidos que descem da Penha n�o � de hoje, desde o �ltimo ataque da Mil�cia que ocasionou na morte de 8 traficantes do S�o Sim�o.

O pr�prio frente colocado pela lideran�a da Penha, de vulgo PL, j� vinha desagradando, desde o momento que levou pro tribunal um cria do S�o Sim�o com aval do Doca, mas sem provas para isso.

Como ele � oriundo da Penha e da confian�a dos chef�es Doca e Piranha, ningu�m questionou diretamente.

Mas at� a pr�pria pris�o do bandido conhecido DiMulher, existem boatos que foi uma arma��o do PL. Ele informou que iria ter uma opera��o em Queimados e era pra ele atravessar. Na travessia, foi pego pela policia.

Muitos crias levam o atual frente como X9 para conseguir cargo alto em Queimados, por essa raz�o tem a desaprova��o de 90% da hierarquia.

Pra piorar, bem perto dali existe o Morro da Torre, controlado pela gest�o de Parada de Lucas (TCP). Mesmo em menor n�mero em Queimados, se mantiveram fortes na regi�o e com acordo de paz com a Mil�cia local.

Entretanto, a c�pula do CV entende que desse jeito em Queimados esta certo, porque a lideran�a da Penha esta tomando conta de tudo, e se houver insatisfeitos, eles deslocam mais soldados da capital para refor�ar.

Vamos Aguardar.

�udio mostra TCP recrutando insatisfeitos da Penha

O conflito entre as fac��es do Terceiro Comando Puro contra o Comando Vermelho que domina o Complexo da Penha, continua a todo vapor.

Nas redes sociais viralizou um �udio que, supostamente seria do criminoso conhecido como “Dino”, que por �udio, estava tentando recrutar bandidos da Penha para o seu lado na Cidade Alta (TCP).

No �udio, ele pede que o “insatisfeito” em quest�o, pegasse um fuzil da Penha e escolhesse um local para um carro busca-lo at� a Cidade Alta.

Como visto no v�deo acima, apenas alguns �udios foram revelados nessa longa conversa pelo aplicativo Whats App.

Tamb�m n�o podemos confirmar de qual tempo foi essa conversa.

Sabemos que h� tempos os traficantes do CV que est�o “pulando” para o lado do TCP na zona norte, vem tentando recrutar mais pessoas insatisfeitas.

O foco agora � enfraquecer o territ�rio poderoso do CV no Complexo da Penha.

S� o fato da tentativa de recrutamento em massa dos soldados da Penha, al�m do baque que aplicaram na Vila Cruzeiro h� meses atr�s, vem tirando o sono dos frentes e gerentes do complexo.

Escaldados com tudo e todos, est�o olhando os celulares de soldados da Penha, e est�o sumindo com moradores que possivelmente poderia estar passando informa��es para quem pulou pro lado do TCP.

Traficante do CV pulou para Baixa do Sapateiro levando

Na onda do “pula pula” , mais uma vez apareceu um epis�dio de troca de fac��o dentro das comunidades do Complexo da Mar�, na zona norte do Rio de Janeiro.

Um traficante que atuava no Parque Uni�o (CV) dentro da Mar�, pulou para o lado do Terceiro Comando Puro, levando dinheiro da boca e 1 fuzil.

Ele n�o tinha cargo alto dentro da hierarquia do P.U, mas foi uma perda que irritou a lideran�a do Parque Uni�o.

Prometeram entrar na Baixa do Sapateiro (TCP) para s� pegar o “traidor”, e buscar o fuzil de volta.

Vamos aguardar.

Context specific FDR for top down proteomics!

On the bridge of the Starship Northwestern, Captain Kelleher and his crew are exploring the farthest reaches of proteomics, going where no lab has gone before.

I just had the worst idea ever — and — of course there is an internet tool where you can take anyone’es picture and “Trek” it.

(…sorry…)

What started this ramble? Well, while we’re here on earth still struggling with accurate estimation of FDR for linear and slightly modified peptides, on the Starship Northwestern they’re beaming down tools for accurate estimation of FDR for freaking intact proteoforms!

How are you currently assessing FDR for proteoforms? I’ll tell you how I am. I’m not. I’m so pumped that I’ve identified a few dozen proteins from fragmenting their intact forms that I’m just popping them into my list. And — I’d wager that is what basically everyone is doing outside the 4 labs that do top down proteomics each and every day. And if you’ve got an exact mass and some sequence information and you can check your 24 proteins that is probably even okay.

However, if you’re really getting hundred/thousands of IDs? You need a real way to estimate these and this great new tool (which is freely available on Github here) provides a real starting point on these calculations. And it turns out that context is very very important.

The authors pressure test this tool using a true known sample and by reanalyzing some previously published materials to show that for today’s top down proteomics both on earth and out there where they’re exploring, this is the way to engage…

….your results.

Quantitative live cell imaging + proteomics shows real time influenza progression!

This brand new study at Nature something or other is timely, interesting and shows a combination of techniques complementing each other I’d never have thought of!

Live cell imaging? That can’t help with proteomics…I mean…how does looking at the surface of a cell help?

It turns out that, live cell imaging (light microscopy!) has gotten massively sophisticated! Those images at the top are Rab11 foci!  So… live cell imaging of protein complexes inside a normal human cell. That’s pretty awesome all on it’s own, right?

What could make it even better? Involving proteomics, obviously, but — you know — let’s leave that part out of the title. THEN let’s do something that is right at the front of everyone’s mind right now — influenza!!

If that doesn’t make you want to read this, we probably can’t be friends.

Rab11 is a protein that maintains other proteins at the cell surface and helps recycle the vesicles. This group shows how the influenza virus messes up Rab11(a?) function by what appears to be messing up the dyneins. You can’t figure out that it’s the dyneins by even the fanciest of light microscopes, but you can by immunoprecipitation-mass spec assays! Speaking of which, I’d like to direct your eyes to a great way to display data from IP-MS/AE-MS.

Whoever did the plots for the study knows how to drive home the results and conclusions. But if that isn’t enough for you, all the data is available at PRIDE via ProteomeXchange here.

Take it all together? And we’ve got a better understanding of how influenza screws up a key and massively evolutionarily conserved system. Could you have done this study with just protoemics? Probably! However, the light microscopy is surprisingly useful toward driving the point home and the images are stunning. I’d probably put something snarky about how this is a good lesson in catering to the people who still don’t understand why we’re still going on about that mass spectroscopy stuff, but I’m almost over this goshdarned virus and my mood is much better, so I won’t.

Design a site like this with WordPress.com
Get started