MaxQuant Summer School 2019 videos are up!

What great timing. I was just whining about how I can’t make Perseus do something that seems really simple in my head — BOOM! 4 new Perseus videos!

You can access the MaxQuant Summer School videos on the YouTube page here.

I’m personally going to start with video T4. Because I suspect I’m missing something important right at the beginning in my dumb pipeline.

Precise protein turnover — IN LIVE ANIMALS — the ultimate protocol!

Do you have 4-5 weeks?

Do you need to get an absolute understanding of the rates of protein turn-over IN A LIVING ANIMAL SYSTEM?

This isn’t the first technique for protein turnover measurements. This may be, however, the most complete picture that we’ve been able to get.

If your strengths aren’t exactly centered in the wet lab aspect of proteomics does this look a little bit like a nightmare? Yes. I can confirm. However, it’s only the first 70 steps in the protocol that will negatively affect my already erratic sleep patterns — at 71 we get to the data processing….yeah…it’s MATLAB…but it’s already all done for you!

What do you get out of this? A comprehensive and precise measurement of protein turnover in an entire organism — like, for real, whatever organ or system you care about — up to and including ALL of them.

Forensic proteomics is coming fast — Genetic variation detection in hair keratins!

Recently there has been an explosion of new evidence that proteomics has value in forensics analysis. While it’s obvious that this is a great thing — I’d also argue that it might be kind of a scary thing as well. Could you, for example, determine every sample I’ve ever prepared in my life from the RAW data by identifying a specific keratin peptide variant that is unique to the majestic Pugs that I’ve dedicated my life to rescuing and protecting from a world that isn’t nearly good enough for them?

This new study from NIST suggests that — yes — this and possible AND can even be used for the identification of human genetic variants (which you could effectively argue might be an application of this technology that would be slightly more widely applicable…I guess….)

I’d like to point out a technical in this study that is really cool. They did In-gel digests of these hair samples. The gels were then stained with SimplyBlue Safe Stain. Then the gels were scanned.

Why’d they scan the gels? To determine where to cut the gels so that the protein loads were thereby equivalent!

Should I know about this? Why haven’t we all always done this when using SDS-PAGE to fractionate our proteins? We could break out the scanners and the Windows XP software that is up on a shelf somewhere from the days of 2D-gels and make them easily do this, right?

Back to the study — they use all sorts of different extraction conditions and protocols and that is a big part of the study — developing the methods to do this, but I’m obviously going to focus on the data — and this is reaaaally cool.

They’re starting with a standard and well-characterized hair sample (cause you can obviously get standard hair material(?)) and they use MSPepSearch to analyze the peptides from the digested hair. 40% of the peptides don’t match anything in the NIST human spectral library database. 40%!!

In my mind there are 2 main causes for this and my first guess would be
1) The default button in MaxQuant and other software to ignore the common lab contaminants. I’m sure I’ve mentioned before my difficulty in studying phosphorylations in keratins because the software just hid them by default — geez — that was almost a decade ago…. my layout for PD 2.4 is still set to hide wool, Pug and trypsin peptides
2) Is it individual variation? Could it be THAT prevalent? That would be nuts, right?

The authors deploy NIST Hybrid Search to answer this question. If you haven’t tried this, you should. FAST and accurate identification of delta shifted spectra against spectral libraries. I feel like I’ve given away too much stuff in this great paper already. It is NIST, so the paper is open access.

STRING 11.0 — You should take time to revisit this resource!

Talk about a surprise! I am cranking on this cool dataset for a talented young biologist and I thought — what the heck — I haven’t put anything into STRING in so long I’m not even sure if it is still supported and — 
The output is just stunning — and reeeeeeeaaaaaaaaly helpful for his model. Almost all the pieces fall right into place for this phenotype….obviously results will vary depending on your model, coverage, etc., Dr. JJ Park did the proteomics on these samples on an HF-X and the data is as good as I’ve ever seen, so that doesn’t hurt at all. 
I suggest that if you put some data into String in 2013….
….and blocked the site on your browser so it would never happen again that you consider a revisit. This isn’t the same thing at all anymore. 

It’s not just me being out of the loop either, v11 is a substantial upgrade. Not only does the number of organism double, and the libraries that it reference increase markedly in this release, but this is the first version that allowed the upload of complete genome/proteome sized datasets. In fact, it gives you all sorts of warnings if you attempt to upload just the proteins that you’ve determined are significant. By default is wants to take all your data.

100% recommended you check it out!

Picky — Shiny magic to build the ultimate targeted assay online!

I’ve mentioned Picky on this blog before, but I don’t think it’s possible to bring enough exposure to some tools and Picky is definitely one of them.
You can read about it at Nature methods here
But that’s probably not what you actually want to do. What you actually want to do is go here: 
And use this awesome Shiny app to just build your method of choice. Look, you can build your own awesome PRM or SRM targeted experiment. You can think really hard about cycle time on your D30 vs your D20 system or flip a coin to decide whether you should use static dwell time or set a maximum cycle on your newest triple quads. Or…you can focus on your experimental design and data output and just design your targeted experiment with…. 

The clip I took from the one I’m building is chosen because I need to target an alternative sequence isoform. Which I could definitely do this morning — OR — I could just press the button on Picky…..

…and magically open the door to selective targeting of Proteoforms!

All jokes aside, if there is an easier way in this world of dealing with targeting alternative protein isoforms, send me an email so I start using it!

RiboSeq is better than RNASeq for correlating with protein abundance but still not the same thing!

At 3 meetings I spoke at this year, I ran into an enthusiastic person after my talk who wanted to give me Ribo-Seq data so we could compare our proteomes and “translatomes”. 
I get a lot of offers to take hard drives full of other people’s data and spend all my free time on it. If you read this blog and can’t relate, you’re probably here for the dog pictures? 
You’re welcome! (He’s already bored with this post) 
Ribo-Seq (RiboSeq?) is otherwise known as Ribosome Profiling (wiki). The idea is surprisingly simple. In RNA-Seq (RNASeq?)you measure all the transcripts in a cell. A lot are floating around just doing nothing (probably something but not correlating directly with protein abundance), but some are with ribosomes making useful proteins. If you dump in an enzyme that chops up RNA all the stuff that is floating around gets chopped up, but the ones at the ribosomes are “protected” and don’t get chopped up. 
If you wash away the little chunks of digested DNA (and the enzyme that chopped them up) and liberate the RNA from the ribosome and sequence that then you know what RNA was being translated into protein at that moment
Great. Those should correlate, right? Or at least better?  That’s the question of posed by the authors of this recent preprint
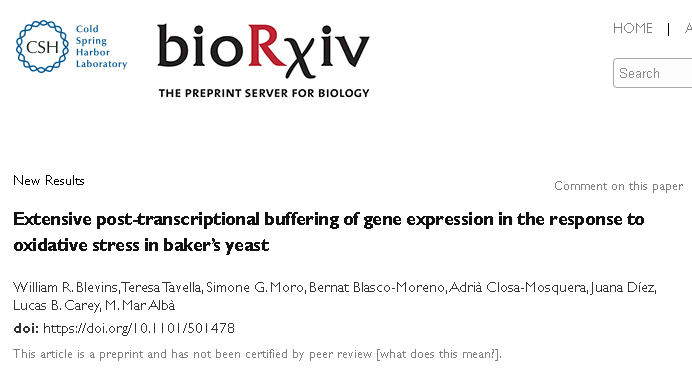
The test was basically 2 conditions — Relaxed yeast and stressed out yeast (some sort of oxidative stress thing) 
Proteomics was performed with a 90 minute gradient on an Orbitrap Fusion II 
RNA-Seq and Ribo-Seq were also performed.
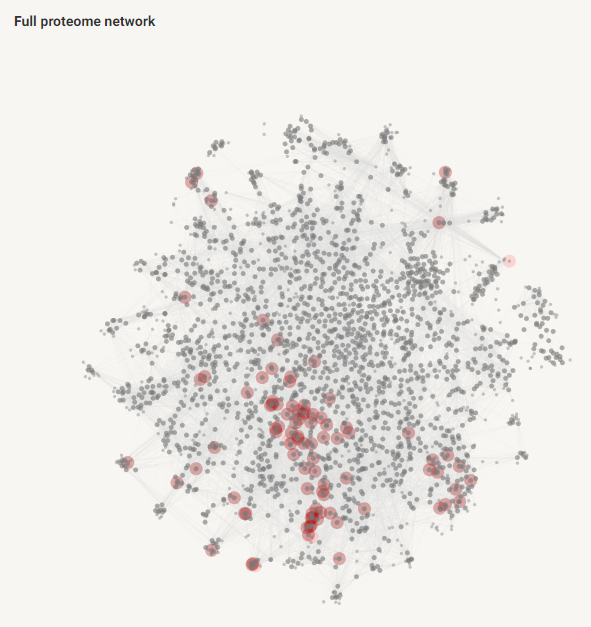
The picture at the very top of this post is the correlation. This is very funny to me because earlier this year when I was designing loads of targeted methods for regulated assays I will always remember when a smart young grad student came to me and said — “my R is only 2 9s, is that okay?”  That’s when I knew I wasn’t needed there anymore. She was worried about her 7 point SRM standard curve not exceeding 0.99!” Not the same thing, of course, but seeing a RNASeq to proteomics “correlation” of 0.46 puts things into context.
RiboSeq does seem to correspond better to protein abundance. It sure isn’t a 0.9 — even in an organism that only produces around 4,000 proteins under maximum conditions. 
Cool study, right?!? A big thanks to the authors because it answers a question a lot of us are going to get. Answer? Yes. It is better. Global proteomics is still better. Targeted protein quan is still the best — if you take proteoforms into account! 
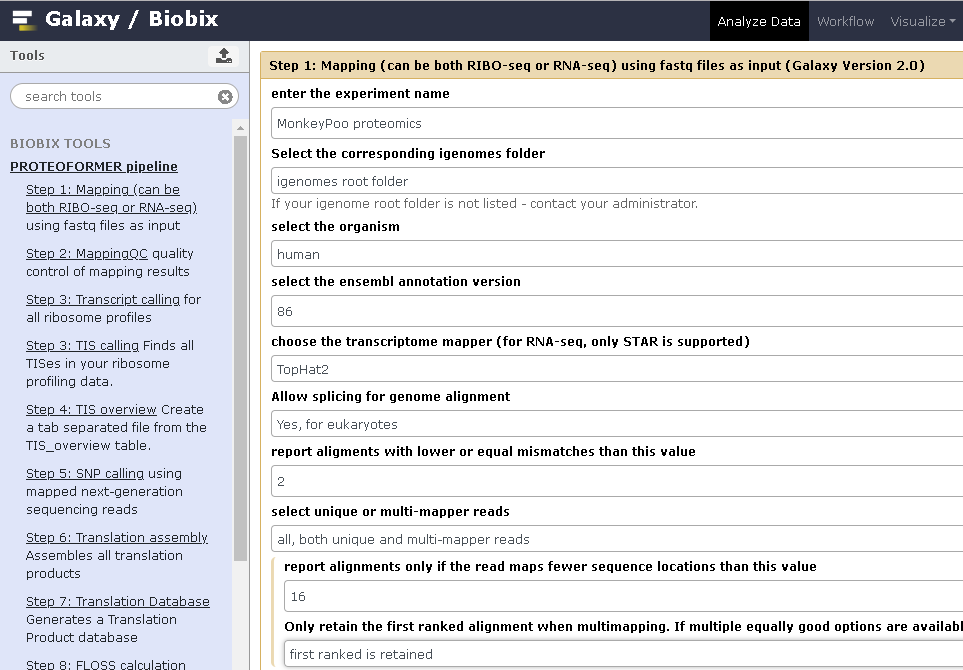
On this topic — I do have some RiboSeq data coming my way in a few months. I fired up the big Linux box and started making a list of pros/cons for changing my Linux distro (I’m running Pop!_OS which is pretty great — natively encrypted, developer centric, but even though it’s built on Ubuntu it isn’t always the most straight-forward for me — the biggest example is that it natively comes with R Commander, which is a step down in my mind from R Studio) because it’s Galaxy and PROTEOFORMER time! 
I don’t know if it was with Proteoformer or the new update, but these great people in Belgium (?) set up a Galaxy instance that we can use!  You can link to it from their github here!

ProteomeHD.net — A coregulation map of 12.5MILLION human protein measurements

I’m as close to without words as I may be able to get.

As awesome as this new study is, it sets a scary new bar for what biologists and clinicians can expect from the interpretation of -omics datasets.

You should just go check it out here: www.ProteomeHD.net

This study goes to a depth of 10,000+ human proteins –with SILAC — and ends up with a coregulation network that has over 12.5 MILLION protein “interactions” (I’m torn on using this word at all since it implies that the proteins may directly physically interact, and coregulation analysis is not a measurement of this).

I’m going to shut up now and read more of this.

I lied — this is the output! (I need to go where I’ve got a bigger monitor. The site does not like little screens, and will reject you from the site if you’re on mobile [at least on an iPhone 4 or whatever I have])

All the RAW files are available on PRIDE (PXD008888) in case you want to mine this beautiful dataset yourself!

Easy & Fast Subcellular Fractionation — All MS-compatible reagents!

I haven’t done a subcellular fractionation in a while, but I’ve got a project coming my way probably since global didn’t do a good job of grabbing the nuclear protein(s) of interest.

Most (all?) of the subcellular fractionation techniques were designed for something else. Maybe they were for getting nuclear DNA or for electron microscopy of mitochondria. They weren’t designed for LCMS, and you can tell because of how much time is necessary to clean out the large list of non-LCMS compatible compounds.

This great new paper (published ASAP, so probably not indexed by your library yet) at JPR couldn’t come at a better time. THIS is my new protocol.

Nothing going into this is incompatible with LCMS. No gross detergents or salts (or sugars…) to remove by solid phase extraction (SPE) or in-gel digestion. A protocol designed for LCMS analysis of subcellular fractions.

The efficiency increase (compared to anything I’ve ever tried) is dramatic. They start with as little as e5(!!) cells and pull out phosphorylation sites(!!) from subcellular fractions!

Proteomics of Single Muscle Fibers!

There is a lot of basic physiology to learn from in this great new study study in “Histology.” It’s so cool to pick up study that you can already follow most of (in my case, the proteomics, most of the time) and then use that framework to fill in all sorts of things you’d never thought about at all.

You can access the preformatted text here (warning, direct download, if that is a problem. I’m having some trouble finding the appropriate Journal link on this tablet.)

How would you start doing some muscle proteomics? Before this popped into my Google feed I would have taken a sample and homogenized enough to digest.

You muddle all the information! There are different types of muscle fibers that are controlled by distinct genetic machinery. There are fast ones and slow ones and there are slow ones that fatigue slow and some fatigue fast, and while these sound like vague generalizations they’re actually distinct tissues with their own proteomic and metabolomic characteristics!

Cool, right?

It is until you realize that an individual fiber may only contain 5 micrograms of protein! Digest and desalt that and you’d better not have a bubble in your NanoLC line. Wait! It’s 2019! If we’re smart about it, 5ug is a ton of material!

They combine some material to build their library and then utilize match between runs (MBR) to characterize the individual materials and obtain plenty of coverage. They find really interesting differences in the mitochondrial proteins of the individual cells of interest and it’s enough for some solid conclusions about the muscle biology.

Quantitative Subcellular Proteomics of Cortex of Schizophrenia Patients!

In the “how on earth did they get enough material to pull this study off?!?!” department, I present this new paper at JPR! 
Have you ever dealt with people with human brains? My gosh, you’d think it all comes directly from the investigator’s skull the way every microgram of material you ask for causes groans and occasional shrieks. This is the precious of precious material. And this group did subcellular proteomics — with SCX fractionation and iTRAQ quantification on an Orbitrap Velos!!  That says to me that they started with more total material than I’ve ever been able to get from anyone. Good for them. 
It’s nice data as well. I’m a little thrown off by the 0.1 Da MS/MS tolerance, but the downstream processing was cleaned up with InfernoRDN. I’ve not used this, but I worked with a bioinformatician on a project a few years ago who was from that Pacific North North Lab place and he definitely erred toward the whole “higher MS1 and MS/MS windows than you’d like to use so the FDR calculations had more suboptimal data to work off of to make better clarifications school of thought, so this probably makes sense. 
What do we get out of this? A really nice picture of the disease in different subcellular fractions! Information sorely needed out there for this and basically all of the other neurological diseases.

Design a site like this with WordPress.com
Get started